Winter 2016 (Volume 26, Number 4)
How to Analyze Clinical Trial Research in Rheumatology
By Philip Baer, MDCM, FRCPC, FACR; Michael Starr, MD; Nigil Haroon, MD, PhD, DM
Download PDF
Introduction
Rheumatology is a rapidly changing specialty with hundreds of clinical trials being published in the field every year. It is nearly impossible to keep up with the literature, and almost as difficult to discern which trials provide valuable new knowledge, and which have little to offer the practising rheumatologist.
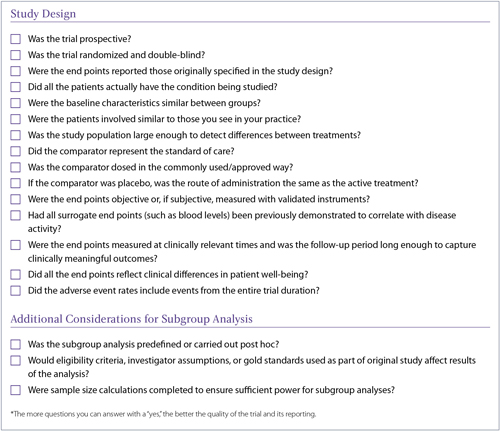
The goal of this article is to help solve this problem. We will briefly describe the characteristics of well- and poorly-designed trials thereby serving as a guide to identify when a trial’s design, analyses, or conclusions suffer from errors that range from poor choice of patient populations to misidentification of a class effect among agents. A checklist has also been created that can be used to quickly assess new research reports and assist in interpreting their conclusions.
Study Design
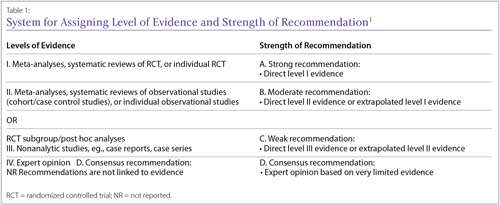
Depending on the type of clinical evidence available, the risk of bias varies. It is important to be aware of the level of clinical evidence before interpreting the results. Based on the level of evidence available to answer a particular clinical query, or research question, the strength of recommendations varies. This is universally accepted and recently the Canadian Rheumatology Association (CRA) rheumatoid arthritis (RA) guidelines used the same grid (Table 1).
Type of study
Prospective trials look forward and track the development of outcomes over time in their chosen populations. Retrospective trials look backward at past records to determine whether certain risk factors or past interventions that differed between two groups influenced specific outcomes. Although retrospective trials can produce useful long-term data, certain kinds of bias are more common in retrospective than in prospective studies, and this can affect the validity of their results.2,3 In addition, retrospective studies may lack necessary baseline parameters that are required to be controlled to assess independent effects.3 For example, a retrospective examination of septic arthritis as a complication of RA over 35 years was done at a single centre, but information on disease activity, functional outcomes, and structural damage, factors that could affect the outcome, were not available for most patients.4
Randomization and blinding are excellent methods to minimize bias. If patient allocation to treatment groups is not randomized, investigators may inadvertently place patients who are sicker into the treatment group they believe is more effective. If the study is not blinded, patients, investigators, and outcome assessors may overestimate treatment effects, especially for subjectively assessed outcomes.5 Both lack of randomization and nonblinding have been associated with an increased likelihood of a new therapy being found to be superior to its comparator.6
Even randomized controlled trial results obtained by post hoc or subgroup analyses are subject to bias.7,8 A post hoc analysis examines the data after the trial is completed and reports on end points that were not prespecified in the study design. It has been suggested that not disclosing to the reader that an analysis is post hoc should be considered scientific misconduct.9
Subgroup analyses involve analyzing the data in specific patient groups (divided by age, sex, disease severity, or other factors) to see whether a treatment worked particularly well in a particular type of patient. Unfortunately, if enough subgroups are specified, the likelihood of a false positive result increases: carrying out 10 subgroup analyses results in a 40% chance of at least one producing a false positive result at the p < 0.05 significance level.7 A correction factor for multiple comparisons, such as the Bonferroni correction, should be used in this situation.10
Patient population
Clinicians can apply the results of a trial to patient care only if the trial patients resemble those seen in clinical practice. The first table in a clinical trial report usually summarizes the characteristics of the patient population, including age, sex, disease severity and/or duration, comorbidities, and medication history. Ideally, trial patients should be similar to practice patients in most of these respects. In particular, trial results observed in patients who are more or less ill, in a different age group, of a different sex, have more or fewer comorbidities, or have failed more or fewer previous medications are less likely to be applicable to all patients with the studied condition. Check for allowed rescue therapies and concomitant medications as well as baseline differences between the treatment groups. It has been estimated that only 5% of patients seen in typical rheumatology clinical practice would be eligible for RA clinical trials based on common inclusion and exclusion criteria.11
Decisions around patient recruitment techniques may result in a skewed patient population. For example, a recent low back pain trial recruited all patients from a single back pain clinic in a tertiary hospital.12 A patient population from such a specialized setting may not reflect the average Canadian clinician’s practice in terms of sociodemographic characteristics, lifestyle factors, or circumstances, and the trial’s results may therefore not apply to patients outside this small population.
To avoid this limitation, large trials often recruit patients from a wide range of centres, ideally in different parts of the world. However, this carries its own risk of lack of standardization of both the intervention and the end point measurements. In addition, trials done in areas with poor access to health care may show higher than usual placebo response rates due to patients remaining in the trial in order to access otherwise unavailable medical care. (P. Baer, personal communication, June 15, 2016) Risk profiles reported in studies conducted in populations with higher rates of geographically endemic conditions, such as tuberculosis or hepatitis, may not be applicable to other populations.
Sometimes a trial is designed to include only patients in a certain age or disease severity category. For example, although the original Trial of Etanercept and Methotrexate With Radiographic Patient Outcomes (TEMPO) included RA patients with any level of disease severity if they had failed a disease-modifying antirheumatic drug (DMARD) other than methotrexate,13 a TEMPO extension study included only patients with moderate disease.14 While this was clearly disclosed, it does mean that the study’s results are not necessarily as applicable to patients with mild or severe disease.
Similarly, the RAPID-axSpA trial studied certolizumab in patients with axial spondyloarthritis and found significant benefit compared to placebo. However, the study only recruited patients with a C-reactive protein (CRP) above 7.9 mg/L and/or sacroiliitis on MRI according to the ASAS/OMERACT definition, so its results can only be applied to patients with those characteristics.15
Study populations also need to be large enough to detect a real difference between treatments if one exists; otherwise, a negative result may be meaningless, and the trial misleading to clinicians looking for information applicable to their practices. The number of patients needed to detect a difference depends on the frequency or variability of the outcomes being measured and the expected effect of the intervention(s) being studied, among other factors, and statisticians have developed formulas (power calculations) to calculate it.16,17 However, because patient recruitment can be more difficult than expected, studies may be underpowered and conclude, erroneously, that there is no difference between treatment arms (type 2 error). Furthermore, trials rarely perform power calculations for subgroup analysis, leaving them frequently underpowered and at an even greater risk of false-negative results.18
This was a significant issue for rheumatology trials in the past19 but may still occur. For example, a 2012 trial of combined physiotherapy and acupuncture in patients with severe knee osteoarthritis awaiting surgery found no benefit over usual care, but the required sample size was not achieved.20 A 2014 trial comparing etanercept plus methotrexate with various DMARDs plus methotrexate did not achieve a significant difference in some of its end points due to patient attrition that led to underpowering.22
Similarly, the ABILITY-1 trial for nonradiographic axial spondyloarthritis (nrAxSpA) excluded patients who fulfilled the modified New York criteria for ankylosing spondylitis (AS).21However, central post hoc reading of 102 patient X-rays led to reclassifying 38 patients as indeed fulfilling these criteria. Since the trial included only 185 patients, the reclassification of such a large proportion resulted in low power and the US Food and Drug Administration's Arthritis Advisory Committee rejected an application to extend the indication for adalimumab to include patients with nrAxSpA.23
Interventions
In non-placebo-controlled trials, the choice of comparator is vital: a comparison with an intervention less effective than the standard of care for the condition being treated will not accurately demonstrate the tested agent’s clinical usefulness.24 The ADACTA trial is an example of the issue involved. This trial showed that tocilizumab monotherapy was superior to adalimumab monotherapy in patients with RA. Adalimumab was chosen because it was “a globally adopted, first-line biological therapy (in combination with methotrexate and as a monotherapy) in patients with rheumatoid arthritis who are refractory to nonbiological disease-modifying antirheumatic drugs.”25 However, the known efficacy of tocilizumab as a monotherapy agent, as opposed to the usual use of adalimumab in combination with methotrexate, must be considered when reviewing the trial outcomes.
To be useful in clinical practice, trials also need to reflect commonly used and/or approved doses of both the drug being tested and its comparator(s). For example, a psoriatic arthritis (PsA) trial compared 7.5–15.0 mg of methotrexate weekly to placebo in order to determine the efficacy and safety of low-dose methotrexate. The trial reported no significant difference in the number of swollen and tender joints with methotrexate use. However, given that the dose selected was markedly lower than what is commonly used in clinical practice, the trial’s results are not truly applicable to Canadian physicians.26
Similarly, a low back pain trial compared celecoxib 400 mg/day (the maximum recommended daily dose) with acetaminophen 1,000 mg/day (the maximum recommended dose is 3,200–4,000 mg/day).12 It is not surprising that celecoxib showed superior effects on pain. Another example is the SATORI trial in RA, which compared tocilizumab with methotrexate 8 mg/week—a dose much lower than is usually used in North America.27
Note that even placebo-controlled trials can have inherent bias, since route of administration has the potential to influence how effective an intervention is perceived to be by participants.28,29 Whenever possible, well-designed trials will ensure all treatment arms, including placebo, are administered via the same route.
End points
Study end points need to be carefully defined in order to produce valid results. Disease activity scores, American College of Rheumatology (ACR) responses, and blood test results have predetermined criteria that improve their reproducibility, but more subjective end points, such as assessments of functional limitation, disease activity, or quality of life, may by fuzzier and subject to disagreement. Surrogate measures, such as biomarker levels, may be erroneously accepted as disease outcomes even when they are less meaningful than primary outcomes such as remission. Unvalidated end points (such as the use of spondyloarthritis measures like Spondyloarthritis Research Consortium of Canada [SPARCC] scores in a mechanical back pain study12) may not correlate with disease activity in conditions other than those they were designed for.
End points also need to matter in the sense of reflecting a true change in a patient’s well-being. For example, RA trials often include erosion measurements, and though minimal clinically important differences have been established, the clinical implications of small differences in erosion scores, even when statistically significantly different from the comparator, are not always clear.30 When possible, prior to study initiation, questionnaires should be validated in the condition being studied to confirm that a positive result truly correlates with a change in the patient’s condition.
End points should also reflect an appropriate level of follow-up for the condition being treated. Early results may either underestimate or overestimate long-term treatment results. In particular, studies using the modified Stoke Ankylosing Spondylitis Spine Score (mSASSS) to measure radiographic damage in AS need long-term follow-up to see useful results.
Finally, end points may include adverse events, and the way they are reported is important. Event rates can be exaggerated or downplayed by being expressed differently: as a percentage of all patients, as absolute numbers, as numbers per 100 patient-years, and so on. Make sure the event rates include events from the entire duration of the trial, since not all events have an acute onset.
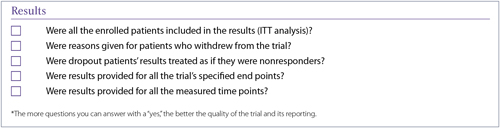
Results
The first diagram in a trial report is often a patient flow diagram showing the numbers of patients recruited, excluded from participation, randomized into each treatment group, and followed up at specified time points (Figure 1). This useful diagram provides a quick way to look at how the study population changed over time and determine how many of the enrolled patients are actually included in the results.
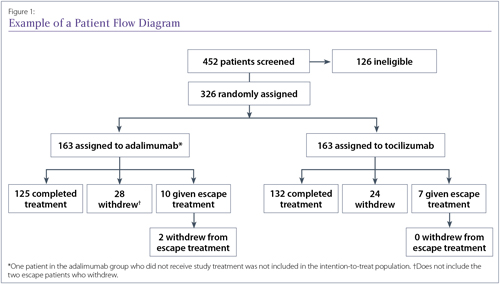
A good example of a patient flow diagram from the ADACTA trial, although details of the reasons for patient withdrawals would improve it.25
Analyzing the data
An intent-to-treat (ITT) analysis looks at the results for all patients randomized to any treatment group, even if they never receive treatment. This is the least biased method of analyzing trial data.31-33 However, some investigators instead do an as-treated analysis, which compares patients based on what treatment they actually received, or a per-protocol analysis, which uses only the data from subjects who met all the protocol criteria and completed their assigned treatments. Not only can the reduced sample sizes resulting from these approaches cause a loss in statistical power to detect treatment differences, but the benefits of randomization are lost.34
Missing data from patients who dropped out can be handled in various ways. A rigorous approach is nonresponder imputation, which assumes that all subjects with missing data didn’t meet the study end points. Another is imputation, where the subject’s other responses are used to estimate the missing data point(s), although it is impossible to check the accuracy of these estimates. A third is last-observation-carried-forward (LOCF) analysis, which uses the subject’s most recent data point in place of the missing one. This is a common approach, but since a key reason for patients to drop out is lack of clinical benefit, LOCF analyses tend to inflate the success rates of all treatment arms.
An even more rigorous approach than nonresponder imputation was used by the Oral Rheumatoid Arthritis Phase 3 Trials Standard (ORAL Standard) study, comparing tofacitinib, adalimumab, and placebo in RA.35 Patients were assessed for nonresponse after 3 months, and nonresponding placebo patients were advanced to active therapy. However, nonresponding patients at 3 months in an active treatment group were not eligible to be categorized as responders at the primary end point assessment at 6 months, even if they had become responders by that time. This is called nonresponder imputation with advancement penalty. The same design was used in the FUTURE 2 trial of secukinumab in PsA and the MEASURE trials of the same drug in AS, making the data look less robust through this stringent trial design.36,37
When examining results, it is also useful to look at when end points were measured. Some trials are ended early for ethical reasons (one treatment has been shown to be so much better than the other that it is unethical to keep patients on the inferior treatment), but it is also possible to publish positive outcomes at interim time points, which may not reflect final study outcomes. This occurred in the Celecoxib Long-term Arthritis Safety Study (CLASS) of celecoxib versus traditional nonsteroidal anti-inflammatory drugs (NSAIDs), with positive results at 6 months being published, whereas the results at the 12 months end point of the trial were negative.38 Look back at the trial protocol to see whether results are being provided for all the time points originally planned, as well as for all the end points listed in the protocol.
Interpreting Results
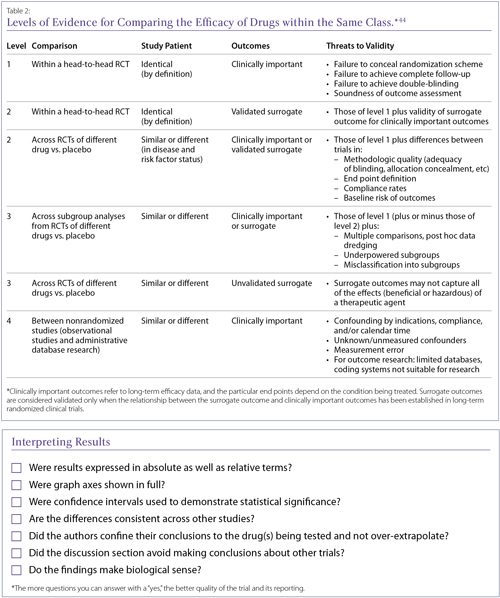
The ways in which data are described affect the way they are perceived. For example, it has been shown that physicians are more likely to use a therapy if its trial results are presented as a relative risk reduction (drug A reduced the risk by 40% more than drug B) rather than an absolute risk reduction (drug A reduced the risk from 10% to 5.8% while drug B reduced it from 10% to 7%) or number needed to treat (NNT; treating 83 patients with drug A instead of drug B would prevent one event).39
Data presentation
There are many ways to show data visually in order to make it easier for the reader to grasp. Kaplan-Meier survival curves are frequently seen in cardiology and oncology trial papers, but less so in rheumatology articles, which tend to use line graphs to demonstrate changes in outcome measures over time. Line graphs and bar graphs can be manipulated, however, most frequently by not including the entire y-axis, which can make an outcomes difference look much larger than it is.
Forest plots (Figure 2) are less common but are especially good at showing efficacy results for either a range of end points or the same end point in several subgroups (or several studies in the case of a meta-analysis). A single line is used to show each result, with a central box representing the mean effect estimate. In meta-analysis plots, the area of the box may vary to show the weight given to each study. The width of the line to either side of the box shows the confidence intervals (CIs) for that result. If they cross the vertical midline, which can represent a relative risk of 1 or a difference between groups of 0, the result is not considered statistically significant, since that means that the true result could lie on either side of the line and thus could favour either side.
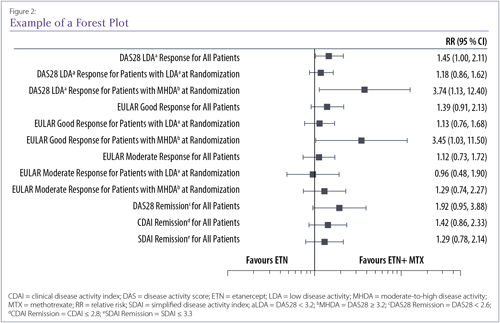
Example of forest plot showing relative risk results for a number of end points in the Canadian Methotrexate and Etanercept Outcome Study40 Where the black box is on the left side of the midline, the result favours etanercept; where it is on the right side, it favours etanercept plus methotrexate. The midline here represents a relative risk of 1, meaning no effect was seen.
Statistics
It has been standard practice for many years to use p values to calculate whether the results in a treatment group are statistically significantly different from those of a comparator group. In recent years, however, p values have come under scrutiny since they depend on not only the data but also the statistical method used and the assumptions made.41 In addition, p values are often misconstrued as representing the probability of the null hypothesis being true (i.e., a p value of 0.04 means that there is only a 4% chance that the null hypothesis is true), rather than the probability of these results occurring if the null hypothesis were true (i.e., if there were no difference between the treatment groups, a p value of 0.04 means there would be only a 4% chance of getting these results by chance alone).
Another disadvantage of p values is that if enough tests are done, some will be positive through chance. A trial design with a large number of end points may be a sign that the researchers are hoping that at least one end point will prove to be statistically significant by the law of averages.
Some journals now prefer9 that statistical significance be expressed through confidence intervals (CIs), which indicate the random variation around a point estimate. Unlike p values, CI calculations produce an estimated point value and show the range of values for the population (not the sample alone) that could plausibly produce that value. Rather than simply rejecting or supporting a null hypothesis, CIs also provide information on the variability (precision) of the sample statistic and its probable relationship to the population from which the sample was drawn.42
Drawing conclusions
In the discussion section of a paper, it is not uncommon to find study authors theorizing about the potential implications of their results. While such hypothesizing can be thought-provoking, it can lead the reader toward conclusions that are not actually supported by the data in the paper. For example, the authors of a placebo-controlled trial paper may discuss their results in comparison with those of another placebo-controlled trial although the two trial designs may have been vastly different. Head-to-head trials are the only way to reliably compare two interventions.
Authors may also discuss the fact that all other published trials involving a specific agent have demonstrated positive effects. This may be an inaccurate assumption: since trials with positive results are more likely to be cited and published, particularly in higher impact journals, than those with negative results, investigators may feel pressure to publish only those papers or report only those end points that achieved statistical significance.7,41,43
Discussions about class effects often appear at the end of papers, since there is a tendency to assume that drugs with the same mechanism of action, or even those only described as being in the same class, will have similar effects. Class effects are difficult to characterize and there is no uniformly accepted definition. This makes it difficult to determine whether a class effect even exists for a set of drugs, before establishing whether a particular agent shares that effect. It has been suggested that rather than assuming a class effect, clinicians apply a hierarchy of evidence when making decisions about drugs within a supposed class (Table 2). In general, it is considered wiser to look for evidence for a specific drug’s efficacy and safety in a specified condition, as regulatory agencies do.
Discussion/Summary
This article has attempted to discuss the many factors that determine whether the results of a clinical trial can be applied to the patients in one’s own practice. This is not an exhaustive review and many articles have debated the details at length. However, it is hoped that we have provided—along with the accompanying checklist for trial quality—an introduction to practising rheumatologists for better evaluation of the trial reports that cross their desks.
Philip A. Baer, MDCM, FRCPC, FACR
Clinical rheumatologist
Chair, Section of Rheumatology,
Ontario Medical Association
Scarborough, Ontario
Michael Starr, MD
Assistant Professor of Medicine,
McGill University
Rheumatologist,
McGill University Health Center,
Montreal, Canada
Nigil Haroon, MD, PhD, DM
Clinician scientist, Rheumatologist,
University Health Network
Toronto, Ontario
References:
1. Bykerk VP, Akhavan P, Hazlewood GS, et al. Canadian Rheumatology Association. Canadian Rheumatology Association recommendations for pharmacological management of rheumatoid arthritis with traditional and biologic disease-modifying antirheumatic drugs. J Rheumatol 2012;39:1559-1582.
2. Papageorgiou SN, Xavier GM, Cobourne MT. Basic study design influences the results of orthodontic clinical investigations. J Clin Epidemiol 2015;68:1512-1522.
3. Berbano EP, Baxi N. Impact of patient selection in various study designs: identifying potential bias in clinical results. South Med J 2012;105:149-155.
4. Dubost JJ, Pereira B, Tournadre A, et al. The changing face of septic arthritis complicating rheumatoid arthritis in the era of biotherapies. Retrospective single-center study over 35 years. Joint Bone Spine 2016 Jun 3. pii: S1297-319X(16)30061-6. doi: 10.1016/j.jbspin.2016.03.008. [Epub ahead of print]
5. Wood L, Egger M, Gluud LL, et al. Empirical evidence of bias in treatment effect estimates in controlled trials with different interventions and outcomes: meta-epidemiological study. BMJ 2008;336:601-605.
6. Colditz GA, Miller JN, Mosteller F. How study design affects outcomes in comparisons of therapy. I: Medical. Stat Med 1989;8:441-454.
7. Stewart LA, Parmar MKB. Bias in the analysis and reporting of randomized controlled trials. Int J Technol Assess Health Care 1996;12:264-275.
8. Hollis S, Fletcher C, Lynn F, et al. Best practice for analysis of shared clinical trial data. BMC Med Res Methodol 2016;16 Suppl 1:76.
9. Ranstam J. Why the p-value culture is bad and confidence intervals a better alternative. Osteoarthritis Cartilage 2012;20:805-808.
10. Ludbrook J. Multiple comparison procedures updates. Clin Exp Pharmacol Physiol 1998;25:1032-1037.
11. Vashisht P, Sayles H, Cannella AC, et al. Generalizability of patients with rheumatoid arthritis in biologic clinical trials. Arthritis Care Res 2016;68:1478-1488.
12. Bedaiwi MK, Sari I, Wallis D, et al. Clinical efficacy of celecoxib compared to acetaminophen in chronic nonspecific low back pain: results of a randomized controlled trial. Arthritis Care Res (Hoboken) 2016;68:845-852.
13. van der Heijde D, et al. Comparison of etanercept and methotrexate, alone and combined, in the treatment of rheumatoid arthritis: Two-year clinical and radiographic results from the TEMPO Study, a double-blind, randomized trial. Arthritis Rheum 2006;54(4):1063-74.
14. van der Heijde D, Burmester G, Melo-Gomes J, et al. Etanercept Study 400 Investigators. The safety and efficacy of adding etanercept to methotrexate or methotrexate to etanercept in moderately active rheumatoid arthritis patients previously treated with monotherapy. Ann Rheum Dis 2008;67:182-188.
15. Landewé R, Braun J, Deodhar A, et al. Efficacy of certolizumab pegol on signs and symptoms of axial spondyloarthritis including ankylosing spondylitis: 24-week results of a double-blind randomised placebo-controlled Phase 3 study. Ann Rheum Dis 2014;73:39-47.
16. Noordzij M, Dekker FW, Zoccali C, et al. Sample size calculations. Nephron Clin Pract 2011;118:c319-323.
17. Malone HE, Nicholl H, Coyne I. Fundamentals of estimating sample size. Nurse Res 2016;23:21-25.
18. Dijkman B, Kooistra B, Bhandari M. How to work with a subgroup analysis. Can J Surg 2009;52:515-522.
19. Keen HI, Pile K, Hill CL. The prevalence of underpowered randomized clinical trials in rheumatology. J Rheumatol 2005;32:2083-2088.
20. Soni A, Joshi A, Mudge N, et al. Supervised exercise plus acupuncture for moderate to severe knee osteoarthritis: a small randomised controlled trial. Acupunct Med 2012;30:176-181.
21. Sieper J, van der Heijde D, Dougados M, et al. Efficacy and safety of adalimumab in patients with non-radiographic axial spondyloarthritis: results of a randomised placebo-controlled trial (ABILITY-1). Ann Rheum Dis 2013;72:815-822.
22. Fleischmann R, Koenig AS, Szumski A, et al. Short-term efficacy of etanercept plus methotrexate vs combinations of disease-modifying anti-rheumatic drugs with methotrexate in established rheumatoid arthritis. Rheumatology (Oxford) 2014;53:1984-1993.
23. Department of Health and Human Services, Food and Drug Administration. Arthritis Advisory Committee Meeting. July 23, 2013. sBLA 125057/323: Adalimumab for the treatment of active non-radiographic axial spondyloarthritis in adults with objective signs of inflammation by elevated C-reactive protein (CRP) or magnetic resonance imaging (MRI), who have had an inadequate response to, or are intolerant to, a nonsteroidal anti-inflammatory drug. Available at: http://www.fda.gov/downloads/AdvisoryCommittees/CommitteesMeetingMaterials/Drugs/ArthritisAdvisoryCommittee/UCM361563.pdf. Accessed May 5, 2016.
24. Estellat C, Tubach F, Seror R, et al. Control treatments in biologics trials of rheumatoid arthritis were often not deemed acceptable in the context of care. J Clin Epidemiol 2016;69:235-244.
25. Gabay C, Emery P, van Vollenhoven R, et al. ADACTA Study Investigators. Tocilizumab monotherapy versus adalimumab monotherapy for treatment of rheumatoid arthritis (ADACTA): a randomised, double-blind, controlled phase 4 trial. Lancet 2013;381:1541-1550.
26. Willkens RF, Williams HJ, Ward JR, et al. Randomized, double-blinded, placebo controlled trial of low-dose pulse methotrexate in psoriatic arthritis. Arthritis Rheum 1984;27:376-381.
27. Nishimoto N, Miyasaka N, Yamamoto K, et al. Study of active controlled tocilizumab monotherapy for rheumatoid arthritis patients with an inadequate response to methotrexate (SATORI): significant reduction in disease activity and serum vascular endothelial growth factor by IL-6 receptor inhibition therapy. Mod Rheumatol 2009;19:12-19.
28. Narkus A, Lehnigk U, Haefner D, et al. The placebo effect in allergen-specific immunotherapy trials. Clin Transl Allergy 2013;3:42.
29. Benedetti F, Dogue S. Different placebos, different mechanisms, different outcomes: lessons for clinical trials. PLoS One 2015;10:e0140967.
30. Bruynesteyn K, van der Heijde D, Boers M, et al. Determination of the minimal clinically important difference in rheumatoid arthritis joint damage of the Sharp/van der Heijde and Larsen/Scott scoring methods by clinical experts and comparison with the smallest detectable difference. Arthritis Rheum 2002;46:913-920.
31. Montori VM, Guyatt GH. Intention-to-treat principle. Can Med Assoc J 2001;165:1339-1341.
32. Wang Y, Berlin JA, Pinheiro J, et al. Causal inference methods to assess safety upper bounds in randomized trials with noncompliance. Clin Trials 2015;12:265-275.
33. Baron G, Boutron I, Giraudeau B, et al. Violation of the intent-to-treat principle and rate of missing data in superiority trials assessing structural outcomes in rheumatic diseases. Arthritis Rheum 2005; 52:1858-1865.
34. Lee YJ, Ellenberg JH, Hirtz DG, et al. Analysis of clinical trials by treatment actually received: is it really an option? Stat Med 1991;10:1595-1605.
35. van Vollenhoven RF, Fleischmann R, Cohen S, et al. ORAL Standard Investigators. Tofacitinib or adalimumab versus placebo in rheumatoid arthritis. N Engl J Med 2012; 367:508-519.
36. McInnes IB, Mease PJ, Kirkham B, et al. FUTURE 2 Study Group. Secukinumab, a human anti-interleukin-17A monoclonal antibody, in patients with psoriatic arthritis (FUTURE 2): a randomised, double-blind, placebo-controlled, phase 3 trial. Lancet 2015;386:1137-1146.
37. Baeten D, Sieper J, Braun J, et al. MEASURE 1 Study Group; MEASURE 2 Study Group. Secukinumab, an interleukin-17a inhibitor, in ankylosing spondylitis. N Engl J Med 2015;373:2534-2548.
38. Jüni P, Rutjes AW, Dieppe PA. Are selective COX2 inhibitors superior to traditional nonsteroidal anti-inflammatory drugs? BMJ 2002;324:1287-1288.
39. Bobbio M, Demichelis B, Giustetto G. Completeness of reporting trial results: effect on physicians' willingness to prescribe. Lancet 1994;343:1209-1211.
40. Pope JE, Haraoui B, Thorne JC, et al. The Canadian Methotrexate and Etanercept Outcome Study: a randomised trial of discontinuing versus continuing methotrexate after 6 months of etanercept and methotrexate therapy in rheumatoid arthritis. Ann Rheum Dis 2014;73:2144-2151.
41. Chavalarias D, Wallach JD, Li AH, et al. Evolution of reporting P values in the biomedical literature, 1990-2015. JAMA 2016;315:1141-1148.
42. Sim J, Reid N. Statistical inference by confidence intervals: issues of interpretation and utilization. Phys Ther 1999;79:186-195.
43. Fanelli D. Do pressures to publish increase scientists' bias? An empirical support from US States Data. PLoS One 2010;5:e10271.
44. McAlister FA, Laupacis A, Wells GA, et al. Users’ Guides to the Medical Literature: XIX. Applying clinical trial results B. Guidelines for determining whether a drug is exerting (more than) a class effect. JAMA 1999;282:1371-1377.
45. Kennedy HL, Rosenson RS. Physicians’ interpretation of “class effects”: a need for thoughtful re-evaluation. J Am Coll Cardiol 2002;40:19-26.
46. Furberg CD. Class effects and evidence-based medicine. Clin Cardiol 2000;23(7 Suppl 4):IV15-19.
Glossary
Absolute difference: The difference in the size of an outcome between two groups. For example, if drug A reduces an outcome by 10 points and drug B reduces it by 15 points, the absolute difference is 5 points. Contrast relative difference.
Adjusted analysis: An analysis that accounts (by adjusting) for baseline differences in important patient characteristics.
Attrition: The loss of participants over the course of a study, also called loss to follow-up.
Baseline: The initial time point in a study, just before the participants begin to receive the intervention being tested.
Blinding: A trial design procedure in which one or more groups involved in the trial (such as patients, investigators, and outside reviewers) are unaware of which patients have received which interventions.
Case-control study: A study in which patients with a particular condition are “matched” with controls (the general population, patients with another condition, etc). Data are then compared between the two groups, looking for significant differences. Usually retrospective and frequently concerned with causes of disease, rather than treatment.
Censored: In studies where the outcome is the time to a particular event, a term describing the lack of data from participants whose outcome is unknown. For example, if a patient is known to be alive only up to a certain point, “survival time” is censored at that point.
Clinically significant: A description of an effect large enough to be of practical importance to patients and health care professionals.
Cohort study: A study in which groups of people are chosen based on their exposure to a specific agent or their development of a certain condition and their long-term health is followed. May be retrospective.
Confidence interval (CI): A measure of the uncertainty around the result of a statistical analysis. A 95% confidence interval (abbreviated 95% CI) means that if the study were repeatedly done with other groups from the same population, 95% of the confidence intervals from those studies would contain the true value. Wider confidence intervals (eg, 90%) indicate less precision.
Confidence limits: The upper and lower boundaries of a confidence interval.
Control arm/group: A group of study participants who resemble those receiving the intervention being tested but who do not receive that intervention.
Controlled trial: A type of clinical trial in which outcomes are compared to a standard called the control. The control may be another intervention (active control), a placebo (placebo control), or observations from an earlier trial (historical control).
Crossover design: A trial design in which groups of participants receive two or more interventions in a particular order. For example, in a two-by-two crossover design, one group receives drug A initially, then drug B during a later phase. The other group receives drug B initially, followed by drug A.
Double-blinding: A type of masking in which two groups, typically investigators and patients, are unaware of which patients have received which interventions.
Effect size: The difference between two outcomes divided by the standard deviation of the population involved. Effect size focuses on the size of the outcome difference rather than the size of the treatment groups.
Equivalence trial: A trial designed to determine whether the effects of two or more treatments differ by an amount that is clinically unimportant.
Experimental arm/group: The group of participants who receive the intervention that is the focus of the study.
Factorial design: A trial design in which multiple groups of participants receive one of multiple combinations of interventions. For example, a two-by-two factorial design involves four groups of participants. Each group might receive one of the following: drug A and drug B; drug A and a placebo; drug B and a placebo; or two placebos. In this example, all possible combinations of the two drugs and placebo are each studied in one group of participants.
Hazard ratio (HR): A ratio comparing two hazard rates (how long until an event occurs). A hazard ratio above 1 suggests that the group represented by the first number (usually the treatment group) has a higher likelihood of the event over a specified time period than the second group (usually the control group). Unlike odds ratios, which estimate the likelihood of a cumulative event, hazard ratios estimate the likelihood of an event at a specific time point.
Intent-to-treat (ITT) analysis: An analysis of a trial’s results that includes the data from every participant randomized, even if not all of them received the treatment.
Interim analysis: A preplanned analysis that compares the arms of a trial before the trial’s official end. This is done so that a trial can be stopped if the difference between arms is so great that the participants in the arm with the less effective intervention are being put at risk unnecessarily.
Loss to follow-up: See attrition.
Masking: See blinding.
Noninferiority trial: A one-sided version of an equivalence trial, designed to determine whether one treatment’s effect is not worse than another’s by a clinically important amount.
Null hypothesis: The hypothesis that there is no difference between two groups. Trials are done with the goal of disproving the null hypothesis and showing that a true difference exists.
Number needed to harm (NNH): The average number of people who must be exposed to a risk factor over a specific period in order for one person to be harmed by it.
Number needed to treat (NNT): The average number of people who must receive a treatment in order for one person to avoid a negative outcome.
Observational study: A clinical study in which participants are observed and assessed for outcomes but not assigned to specific interventions. Cohort and case-control studies, among other types, are observational.
Odds ratio (OR): The ratio of the odds of an event in one group (usually the treatment group) to the odds of that event in another group (usually the control group). An odds ratio above 1 suggests that the first group is more likely to experience the event, while an odds ratio below 1 suggests that they are less likely.
Open-label: Describes a clinical trial in which masking is not used and therefore all parties involved know which participants have been assigned which interventions.
p value: The probability (ranging from 0 to 1) that the result observed could have occurred by chance if there were no difference between the effects of the interventions in the trial arms.
Parallel design: A trial design in which two or more groups of participants receive different interventions over the same time period.
Phase I study: A study usually conducted with healthy volunteers to determine a drug’s safety.
Phase II study: A study to gather preliminary effectiveness data in patients with a specified condition.
Phase III study: A study to gather more information about a drug’s safety and effectiveness by studying different populations, dosages, and drug combinations.
Phase IV study: A study occurring after regulatory agencies have approved a drug for marketing to gather further information about a drug.
Primary end point: The outcome measure considered the most important for evaluating an intervention’s effect.
Prospective study: A study in which participants are identified then followed over time to observe events. Contrast retrospective study.
Relative difference: The difference in the size of an outcome between two groups, taking their size into account. It is always expressed as a ratio or percentage, not in units. For example, if drug A reduces an outcome by 10 points and drug B reduces it by 15 points, the relative difference is 50% (drug B reduces the outcome by 50% more than drug A).
Retrospective study: A study in which events have occurred to the participants before they are identified as part of the trial.
Secondary end point: An outcome measure that is less important than the primary end point but is still of interest in evaluating an intervention’s effect.
Sham intervention: A procedure or device made to be indistinguishable from the procedure or device being studied but that does not contain active processes or components.
Single-blinding: A type of masking in which one group of people involved in the trial (patients, investigators, or reviewers) is unaware of which patients have received which interventions.
Standard deviation (SD): The average difference between a set of observations and their mean value, which indicates the spread or dispersion of the observations.
Statistically significant: Unlikely to have occurred due to chance alone. Measured by statistical tests that calculate p values and confidence intervals, among other results.
Superiority trial: A trial designed to determine whether the effects of one intervention are greater than the effects of another. Contrast noninferiority trial.
Surrogate end points: Markers (often physiological or biochemical) that can be relatively easily measured and are used to predict or represent important clinical outcomes that would otherwise be hard to measure.
|